Is stockcoinexchange.net Legit Or Scam? : Scam Bro...
stockcoinexchange.net SCAM REVIEW
|
|
|
|
Continuation chart patterns are formations that show sideways price action. Unlike reversal patterns which indicate a change in the trend, continuation patterns actually show that there is a temporary pause in the trend where prices consolidate after a big move
After such a huge price rally, buyers usually take a pause to “catch their breath” before continuing their previous actions. Likewise, after a big drop in prices, sellers will pause, often closing existing short positions to take profits before continuing to sell again. Due to these actions, prices consolidate during traders’ pauses and end up forming certain patterns.
The formation of the continuation patterns is said to be complete after prices break out and continue in the direction of the prevailing trend.
The most common continuation patterns are:
Triangles and wedges are intermediate term continuation patterns whereas flags and pennants are short term patterns.
There are three main types of triangles:
The ascending triangle is bullish whereas the descending triangle is bearish. The symmetrical triangle is a neutral pattern.
Triangle patterns usually have a minimum of four to six reversal points which are required to form the shape of the actual triangle. The more times the triangle is tested the more durable it becomes and the stronger the breakout will be. The formation usually lasts about one to three months long.
Trading the Triangles
The best way to trade the triangles is to trade the breakouts. Just remember to wait for the pattern to be completed wait for a decisive close of the price either above or below the triangle.
Measuring the Price Target
The general methods to calculate an approximate measure of the price target after the breakout is to measure the widest distance of the triangle and then apply this distance to the breakout point and project it in the direction of the breakout.

Symmetrical Triangle
In the symmetrical triangle formation, prices consolidate in such a way that the slope trendline connecting the highs and the slope trendline connecting the lows converge together to look like a triangle.
If the prior trend was down, then prices will eventually break out of the triangle and continue the down trend. If there was an uptrend before the triangle formation, then prices will eventually break out to continue higher.

Ascending Triangle
In the ascending triangle formation, the upper trend line is flat, while the lower line is rising. This occurs because buyers are more aggressive than sellers. It is therefore a bullish continuation pattern which is completed when prices breakout to the upside.

It is important that the price closes above the flat upper line in order for the pattern to be complete and to be called an ascending triangle. We can see this in the chart below. Prices then resume the uptrend.

Descending Triangle
The descending triangle is basically a mirror image of the ascending triangle. In this case, the upper trend line has a downward slope while the lower line is just horizontal. This occurs because the sellers are more aggressive than buyers. Therefore, it is a bearish continuation pattern which is completed when prices breakout to the downside.

It is essential for you to know that the price closes below the flat lower line in order for the pattern to be completed and to be called an ascending triangle. We can see this in the chart below. Prices then resume the downtrend.

Wedges are another form of continuation pattern since they also signal a pause in the current trend. They are somewhat similar to triangles since they are identified by two converging trend lines.
The difference with triangles though is that wedges have a noticeable slant against the prevailing trend. Triangles usually have a more horizontal direction. As a continuation pattern, a falling wedge in an uptrend is considered bullish. A rising wedge in a downtrend is bearish.

A rising wedge is bearish.

Measuring the Price Target
The measuring technique for the price target for wedges is similar to that for triangles. Simply measure the widest distance inside the wedge and project that same distance from the breakout point.
Pennants and flags are another form of continuation pattern but are usually brief in duration in comparison to triangles and wedges. It usually takes less than a month for the pattern to be completed.
Pennant
A pennant is usually preceded by a strong move in prices, almost in a straight line, to resemble a flag pole or mast.
Usually, pennants are said to be flying at half-mast. This is because pennants usually appear at about the halfway point of the whole move. So the distance of the initial price move is approximately the same as the proceeding price move after the breakout. Often we can use the height of this flagpole i.e. the initial move to estimate the size of the breakout move.
We distinguish bullish and bearish pennants.
The bullish pennant signals a bullish price move. Therefore, after a sharp rally, a bullish pennant forms as prices take a breather before running off again in the same upward direction. You can see the strength in the uptrend slows down as the pattern forms but then prices breakout and resume stronger upward momentum.
Looking at the chart below, we can see that after a quick rally, there is a pause and then a blast higher.

Trading
You could have entered a buy position slightly above the breakout point. For your price target, calculate the distance of the initial price move up flagpole and project it upwards from the breakout point.
The bearish pennant signifies a bullish price move. Therefore, after a big fall, the bearish pennant provides a temporary pause in the downtrend for prices to consolidate and sellers to take profits. Prices soon breakout of the pennant and continue downward. In the chart below we can see a bearish pennant.

You could have entered a sell position just below the breakout point and with a price target of equal distance to the mast initial down move.
Flags are similar to channels. This continuation pattern consists of two parallel lines, acting as support and resistance. The slope of the lines can be either positive, negative or zero. This depends on the prevailing trend.
The flag can sometimes just be sideways, and this is usually called a rectangle. Therefore, we could say that generally in a flag formation, the price will trend in a modest reversal, confined within the flag’s top and bottom trend lines, before breaking out in the same direction of the larger move that preceded the flag.
Trading
Assuming we are in an uptrend, a buy signal would occur when the price breaks out and closes above the resistance line upper line of the flag.
If we are in a downtrend, a sell signal would occur when price penetrates and closes below the support line lower line of the flag.
Below is an example of a bearish flag. You can notice how the price fell going into the flag and penetrated the upper flag line resistance line. Also, the price fell going out of the bottom line support line of the flag. Therefore, this is a bearish sign that the price will fall upon breaking out of the bottom of the flag formation.

Below we have a chart with a bullish flag pattern.

A rectangle is another type of continuation pattern. Just like the name implies, it takes the form of two parallel lines where prices are consolidating into a trading range. Therefore, this shows that the market is taking a pause from the previous trend and will likely continue in the same direction of the trend once the price breaks out of the rectangle.
This rectangle formation is usually preceded by a flagpole, which can be used as a measuring target of when price will break out from the rectangle.
Below is an example of a continuation pattern in the form of a rectangle. Prices were in an uptrend before consolidating into a rectangle. The price soon broke out above the upper parallel line of the rectangle to resume the uptrend.

Trading
In the example above we have USDCHF in a downtrend. You could have entered just below the breakout point of the lower rectangle line and aimed for a price target that is the length of the flagpole which is the initial price move down.
stockcoinexchange.net SCAM REVIEW
www.apexmarkets-plus.com scam review
mintonblock scam review
EARNBIT SMART CONTRACTS RECOVERY
ace-capitalfx.com scam review
Technical analysts study chart patterns because they give a good indication of market behavior. Cert...
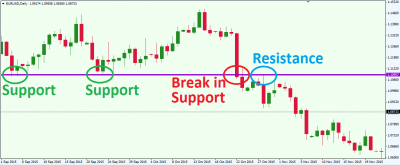
The market does not move in a continuous straight line but rather in a zigzag pattern, creating peak...
Before you start trading, you need to identify the trend of the market. This involves finding the ge...
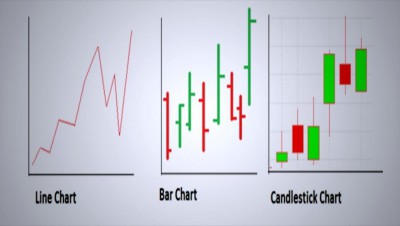
Different chart types can help you analyze price action, the three most commonly used being

A popular way of analyzing the markets is through technical analysis. This method uses charts to stu...
So far you have learned about forex and the basics. You have also decided that forex trading is your...

Want to know the best trading tips today to use to your advantage in the Forex market? This article ...
Now you know the basics, you have chosen your broker, and you are even ready to open a demo account....

Also called trading software, a trading platform is computer software through which you conduct your...
The market is full of online brokers – and each one claims to be the best.

Forex has its own language, that is, special terminology. If you don’t want to be embarrassed ...
The beauty of forex, among other things, is that you can do it anywhere, anytime and you are free to...
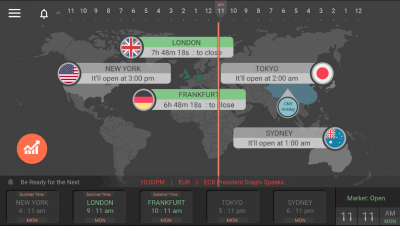
Now you are a bit closer to forex: you know what it is, how you can benefit from it and who the mark...

There are various players in the Foreign Exchange Forex market and all of them are important in one ...

The forex market is unique – and as such, it attracts millions of traders daily, who are busy maki...